Debugging in Emacs
Many experienced Emacs users still switch to CLion or Visual Studio when it's time to debug their C or C++ code.
Introduction
In my years of using Emacs, I’ve noticed a common pattern: developers who are highly proficient at editing source code in Emacs switch to a “normal IDE” (as they call it)—such as CLion or Visual Studio—when they need to debug their code. They usually explain this by saying that Emacs feels a bit weird for the task.
However, I’d much rather not leave Emacs if something can be done inside it.
In this post, I’ll try to show that debugging in Emacs is both simple and effective, especially after a few small adjustments to the default settings.
Debugging in Emacs revolves around two key components:
- GDB (GNU Debugger), the most popular and powerful debugger for C, C++, and other languages.
- GUD (Grand Unified Debugger), Emacs’ built-in interface since at least v19 that turns GDB into a well-integrated debugging environment inside Emacs, allowing you to debug your code without leaving the editor.
A Sample Debug Session
Below is an example of a typical debug session of mine.
In Emacs, I open a source code file (timepoint.c in this example) and
run M-x gdb. GDB then prompts in the minibuffer for the path to the
corresponding executable, as shown below.
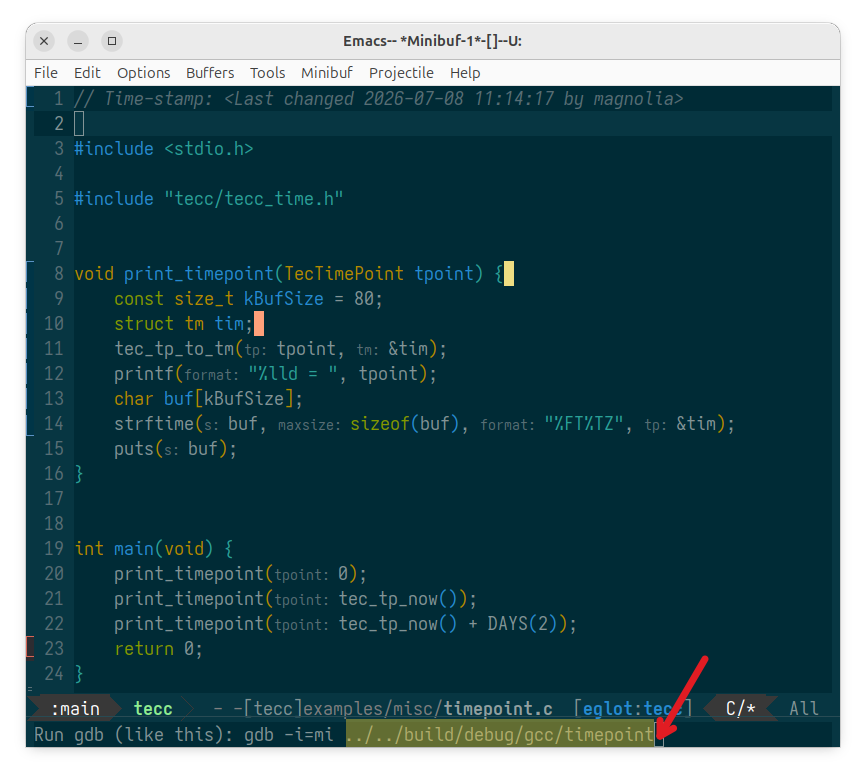
Loading a program to debug. Click or tap to view the full-size picture.
After you enter the path to the executable—assuming it was built
with the -g flag (i.e., compiled with debug information)—and press
Enter
, GDB prints some initial output and may ask whether
it should automatically download missing debugging information from
trusted online servers.
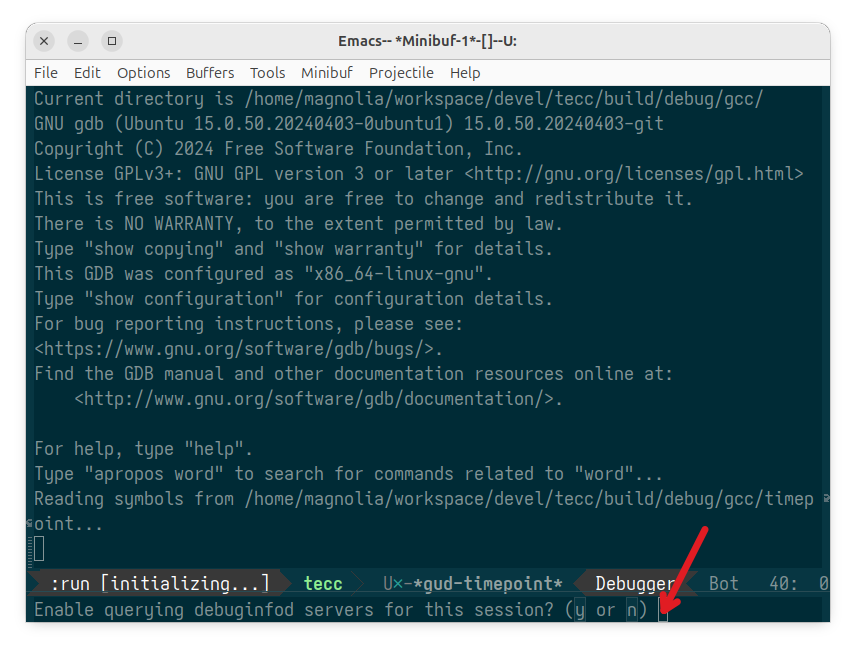
Downloading missing debugging information. Click or tap to view the full-size picture.
Because I don’t intend to debug system or third-party libraries, I simply press n to skip this step, which can occasionally freeze Emacs for a while.
The GUD dashboard appears. It usually consists of 6 windows.
- Debugger, the GUD interaction buffer (or GDB shell);
- C/*, the source code buffer;
- Frames, the stack buffer, a list of stack frames of the program being debugged;
- Locals, the local variables/registers buffer;
- Inferior I/O, the input/output buffer (usually associated with
stdin/stdout); - Breakpoints, the breakpoints/threads list.
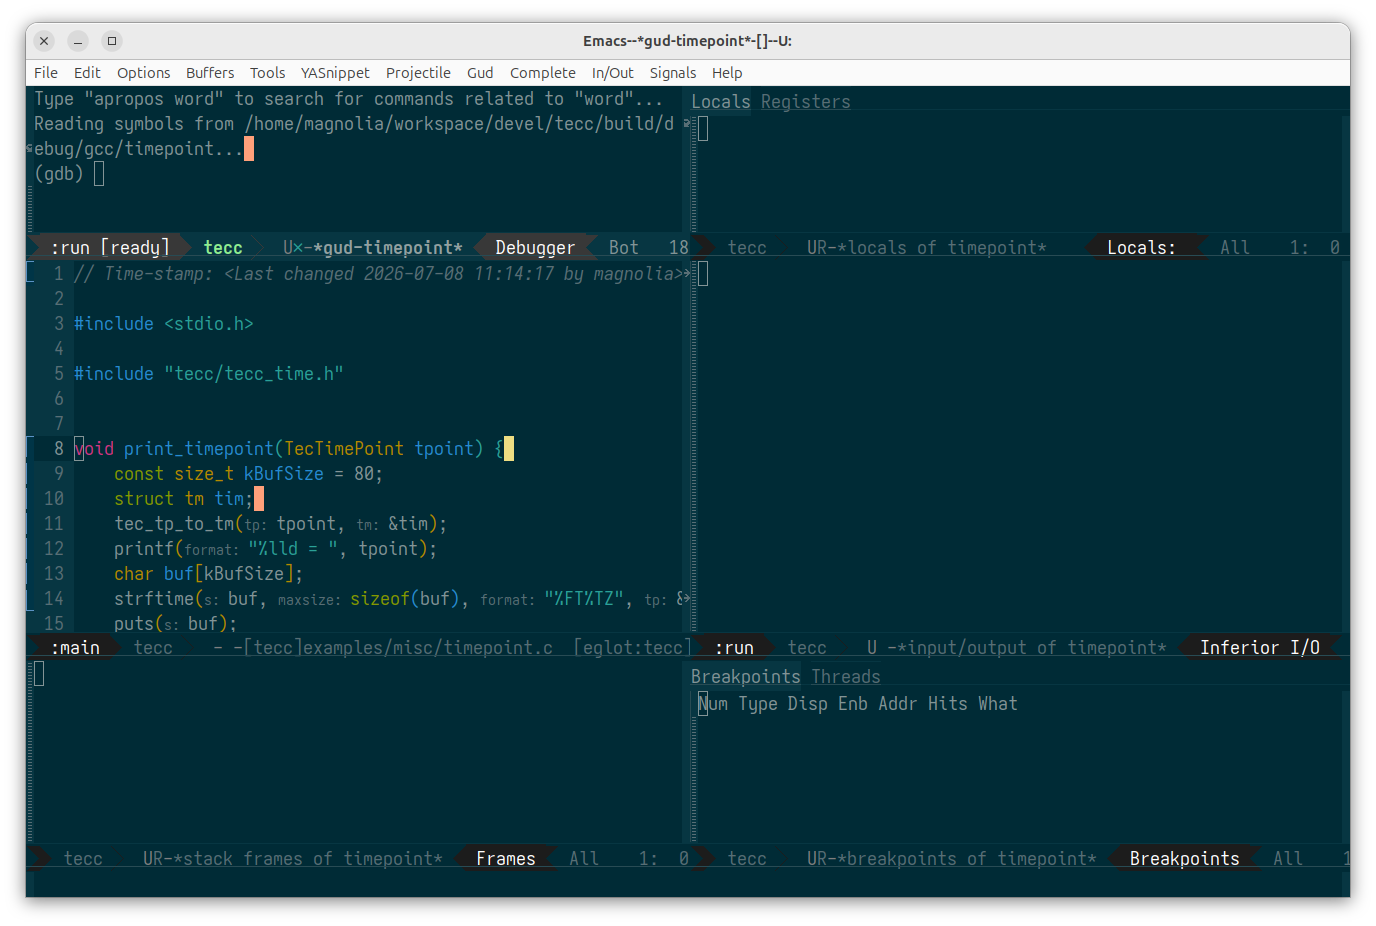
GUD dashboard. Click or tap to view the full-size picture.
In my usual workflow, I type break main (or simply b main) in the GUD
interaction buffer (Debugger) to set a breakpoint at the start of my
program.
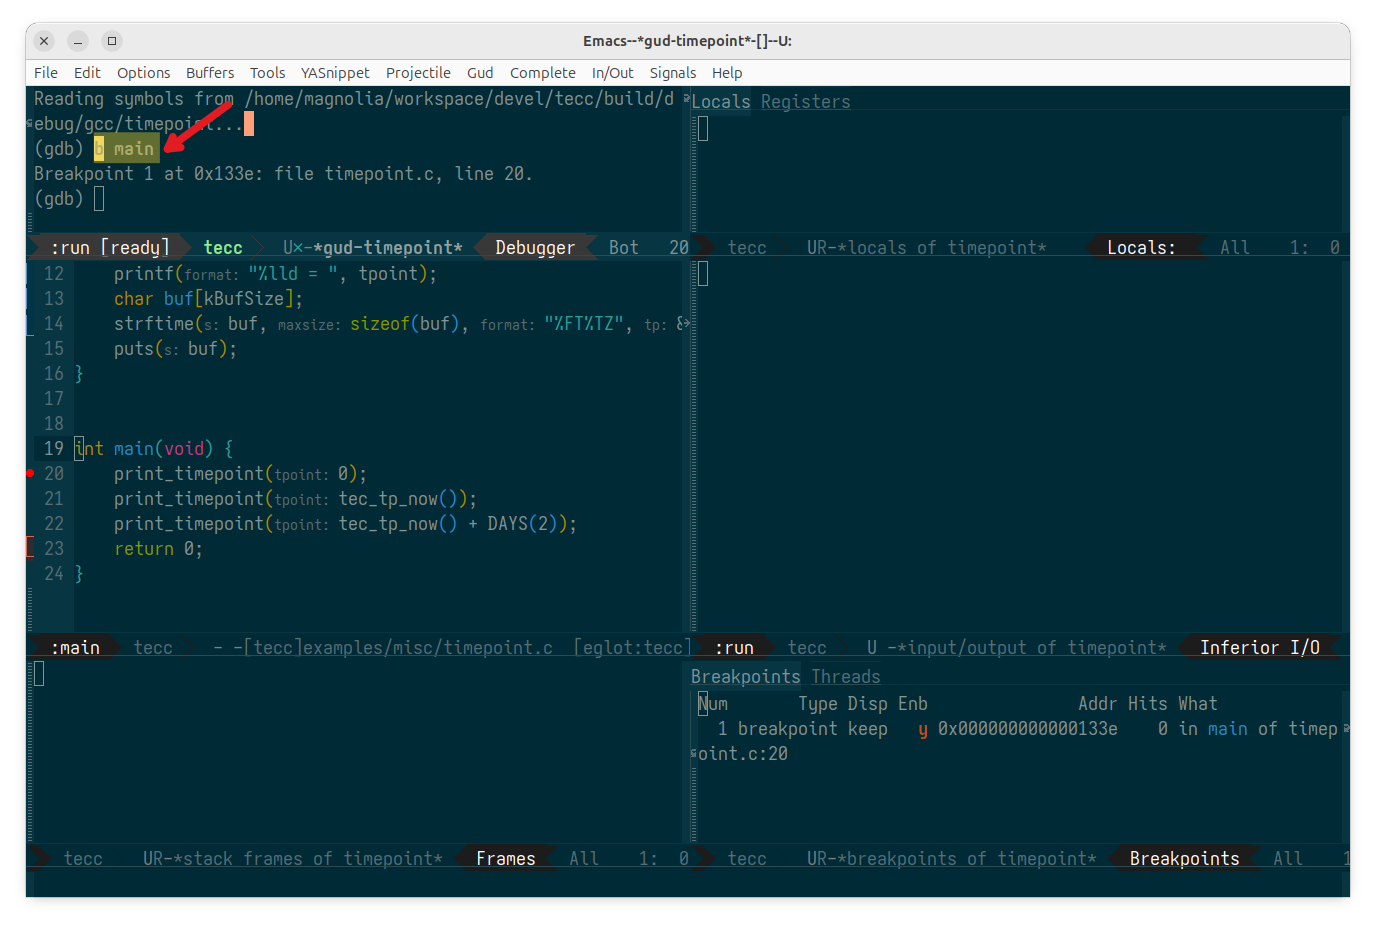
Setting initial breakpoint. Click or tap to view the full-size picture.
The new breakpoint shows up right away: as a red fringe marker next to the line in the source buffer (color varies by theme) and as an entry in the breakpoints list.
Now you can type run in the GUD interaction buffer. Execution will
then stop at the first breakpoint (line 20 in this example).
GUD Keybindings
Frankly, I find the default GUD keybindings somewhat complex. For
example, C-x C-a C-n is the globally defined key chord for gud-next — one
of the most frequently used debugging commands. Having to type
three keys while holding the Ctrl key feels excessive to me, so I
prefer a single keystroke for this operation.
So, in my ~/.emacs, I’ve rebound the most frequently used
GUD commands to F6 and its derivatives.
(global-set-key [(f6)] #'gud-next) ;; Execute the next single line.
(global-set-key [(control f6)] #'gud-step) ;; Enter the called function.
(global-set-key [(shift f6)] #'gud-cont) ;; Continue execution until hitting a breakpoint.
(global-set-key [(control shift f6)] #'gud-print) ;; Evaluate the expression at point.
I’ve kept the default keybindings for the less frequently used
commands, such as setting a breakpoint (gud-break, C-x C-a C-b),
continuing execution to the current line (gud-until, C-x C-a C-u), and
so on.
Additionally, I’ve added a new keybinding for gud-watch (C-x C-a C-w),
which watches the expression at point. This command has no default
keybinding in GUD, at least in Emacs 29.3.
(global-set-key (kbd "C-x C-a C-w") #'gud-watch) ;; Watch the expression at point.
Debugging
Let’s continue with our sample debugging session.
We stopped at line 20, the first breakpoint in my program. Now I want
to step through the function print_timepoint line by line. In the
source code buffer, I move the cursor to line 9 and set a new
breakpoint with C-x C-a C-b (gud-break). Then I continue execution
with Shift + F6 (gud-cont) until the new
breakpoint is hit.
After stepping through the function line by line with F6
(gud-next) until the end (line 16), I get the following output:
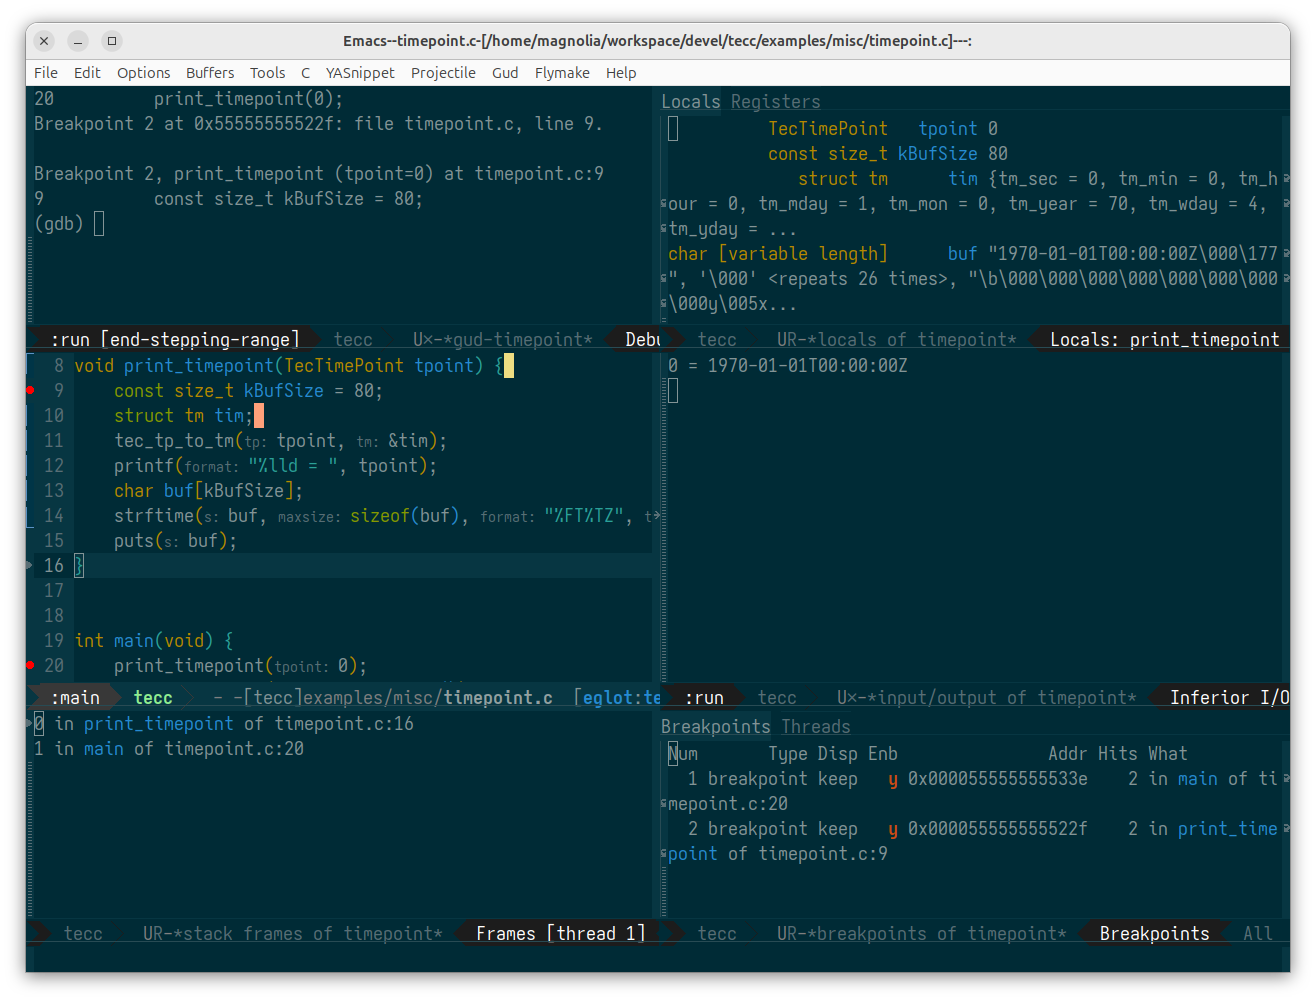
Debugging a function. Click or tap to view the full-size picture.
In the Locals buffer, you can see all local variables and their current values. The Inferior I/O buffer shows the program output. Everything looks correct: the tpoint variable has the value 0, which corresponds to the beginning of the Unix epoch (January 1, 1970).
Indeed, we could have inspected the print_timepoint function by simply
stepping into it (gud-step, Ctrl + F6) directly
from the first line of main, where the initial breakpoint was set. I
used this example to demonstrate more GUD commands in action.
Now we can quit the debugging session by typing quit (or simply q) in
the GUD interaction buffer (Debugger).
Of course, there’s no way to cover all the functions and commands available in GDB/Emacs GUD in one short post but I hope it provides a helpful introduction to using Emacs GUD for debugging your code.
You can find more information in the Running Debuggers Under Emacs manual; the GDB Cheat Sheet (PDF) is also worth having on hand.
Happy debugging in Emacs!
— The Emacs Cat.